
OpenWebRX+ Operating Instructions
The main display is a single-page display with a time-based waterfall and a control panel. Other panels such as log data, admin, etc. can be brought up on demand.
OpenWebRX+ Main Display
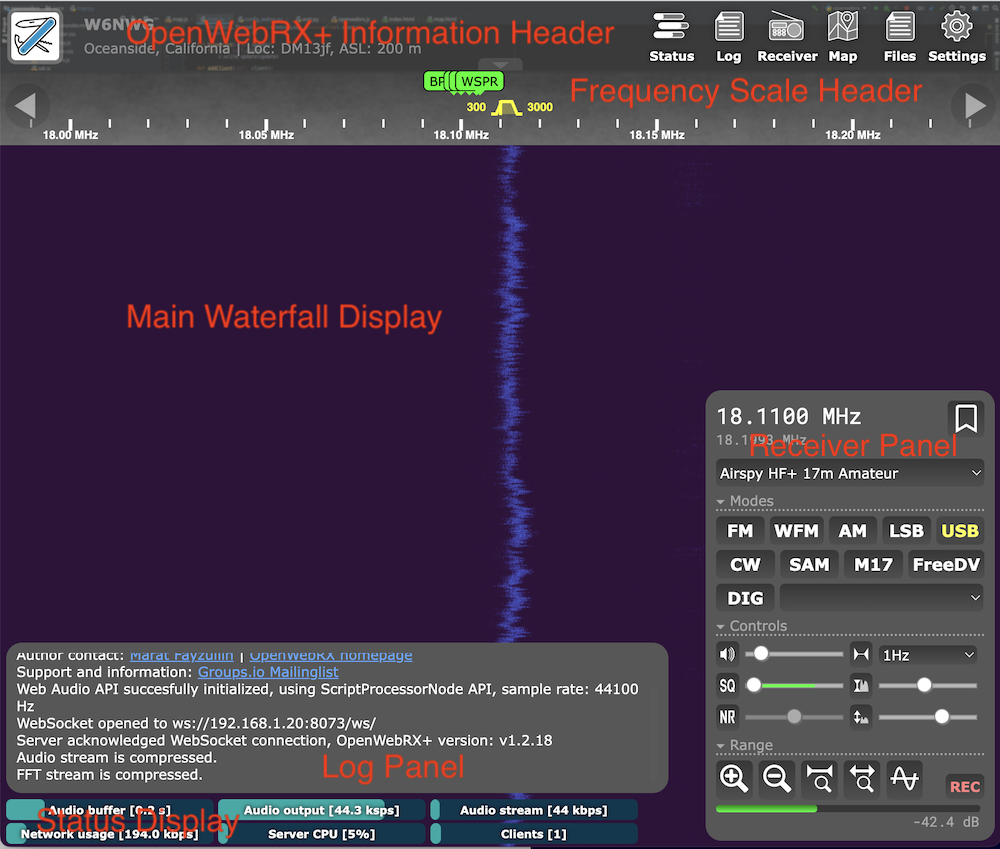
The waterfall itself is pretty typical of waterfall spectrum displays. It presents the detected signals in the band over time in a continuous "waterfall". The colors depict the signal strength. The currently selected frequency is indicated on the Frequency Scale Header at the top.
All of the main controls can be found on the Receiver Panel. There is a drop-down menu for selecting the desired band, called Profiles.
A double row of analog mode buttons lets one conveniently select the audio mode. OpenWebRX+ provides decoders for all of the common analog RF modes. These are used for listening to voice transmissions.
Just below the analog mode buttons is a drop-down selection menu provides for the selection of a digital decoding mode from the very large selection that OpenWebRX+ supports and OpenwebRX+ offers a huge suite of digital mode decoders. Digital modes are a fascinating subject in radio communications and OpenWebRX+ provides easy access through its digital mode extensions.
If you have an interest in exploring digital modes you can easily do that in OpenWebRX+. Just start by selecting some of the color-coded bookmarks arrayed on the Frequency Scale Header.
Audio controls, in the form of sliders, set the squelch level, noise reduction and volume. You can also change the tuning step with the drop-down menu in this group.
At the bottom are a row of buttons that adjust the waterfall itself. There are zoom in and out buttons, a toggle for a Spectrum Display in the Header and a record button.
The last item below these is an S-meter showing signal strength.
A couple of additional info panels are shown on the bottom left of the display.
The top one is a Message Log Panel for log messages. These include the author, current version, websocket connections, etc.
Below that is a Status Panel that shows the number connected clients, audio data stream information and even the CPU temperature of the Raspberry Pi device that the OpenWebRX+ server is running on.
These panes can be shown or hidden by using the buttons at the top right of the Information Header.

Note that the Settings button requires administrative access.
| Information and Control Panels | ||
|---|---|---|
| Information Header | Has information about the station including its callsign and location. | Along the top right are menu buttons to show/hide various panels:
Status → Status Panel Log → Log Panel Receiver → Receiver Panel Map → Map page Settings → Settings Page |
| Frequency Scale Header | Displays a frequency scale for the waterfall display. The selected frequency is denoted with a trapezoidal frequency icon:
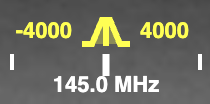 < < | The frequency icon indicates the currently selected frequency and its width indicates the bandwidth corresponding to the selected Mode. The bandwidth can be manually adjusted by clicking and dragging the icon to make it wider or narrower. ⓘ Frequency Tuning |
| Main Waterfall Display | Displays a colored waterfall depicting the signals across the band over time. | Display colors can be adjusted to better show weak signals. |
| Receiver Panel | Has most of the controls for selection of SDRs/bands, modulation and waterfall display. | ⓘ Receiver Panel |
| Log Panel | Shows some information messages. | Author, OpenWebRX+ support URL, connection status, errors encountered, etc. |
| Status Display | Displays server status and connection statistics. | Audio buffer depth and kbps, network bandwidth, server CPU load and number of connected clients. |